I recently had a UA 2192 come into the shop with a dead power supply. UA no longer supports the UA2192 power supply, so I dug in to repair it.
Switching power supplies like the UA 2192 uses are seen by some as a black box, but in reality, they can be readily repaired so long as the main transformer is not damaged. Replacing a few parts got the UA 2192 working and I set about to see what its about.
The UA 2192 is known for its sonic quality as well as the stability of its clock. Indeed, the studio this unit came from used the UA2192 as its clock reference.
The UA 2192 is well built with solid construction inside and out. The power supply is off to the right side and well shielded from the remaining circuitry and the audio circuitry is on the far right, as far as it can get from the power supply to minimize any induced interference.
It uses Universal Audio discrete all FET, dc coupled op amps for all audio work. UA devices are known for their audio quality and reviewing these op amps I can see why. With just a dozen or so FET transistors, DC coupling and all class A circuitry, these are minimal signal path taken to a good extreme! My only gripe is that these op amps are run at +-15VDC, which is kinda low for a device running at +4dBu nominal. As you’ll see in some of the tests below, the UA 2192 strains a bit to deal with high levels of audio; audio that systems with higher power supplies deal with easily.
Analog to Digital Conversion
The measure of a converter rests in its ability to make digits that are true representatives of the analog coming in. In this the UA does a good job, especially considering it was UA’s first entry into the digital world.
A test I like to perform on converters especially is a linearity test. That is, how closely in level does the digital output resemble the analog input. The graph below illustrates this very well with level starting at -145dB referenced to full scale output on the left heading to 0dBFS on the right. This corresponds to the dynamic range of a 24 bit system. This test was run at 96kHz sampling rate.
The test gear does some math to display just the delta from a perfect conversion, or a staright line in the middle of the vertical scale. Any reasonable A/D is going to be linear at the top of its scale, it’s how well the linearity holds up at lower level that makes the difference.
The UA 2192 is perfectly linear to -60dBFS and then is within +-2dB down to =110dB. As we go to lower levels, and less bits, the unit is not as accurate as is shown by the wild swings from 0.
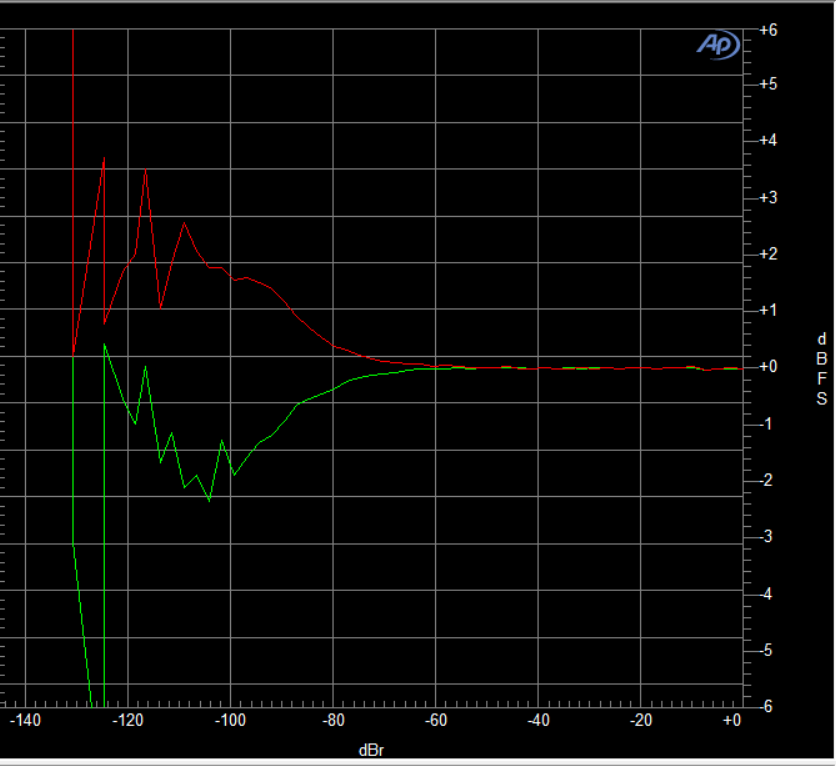
-120dB corresponds to 20 bits of analog data (from the most significant bit) so the UA 2192 is a pretty good 20 bit A-D, but is less accurate in the lowest 4 bits of resolution. A-D conversion is hard and in 2015, when this unit was introduced, converters were not as good as they are today. I expect newer units to do better on A-D, but this unit still sounds great.
Digital to Analog Conversion
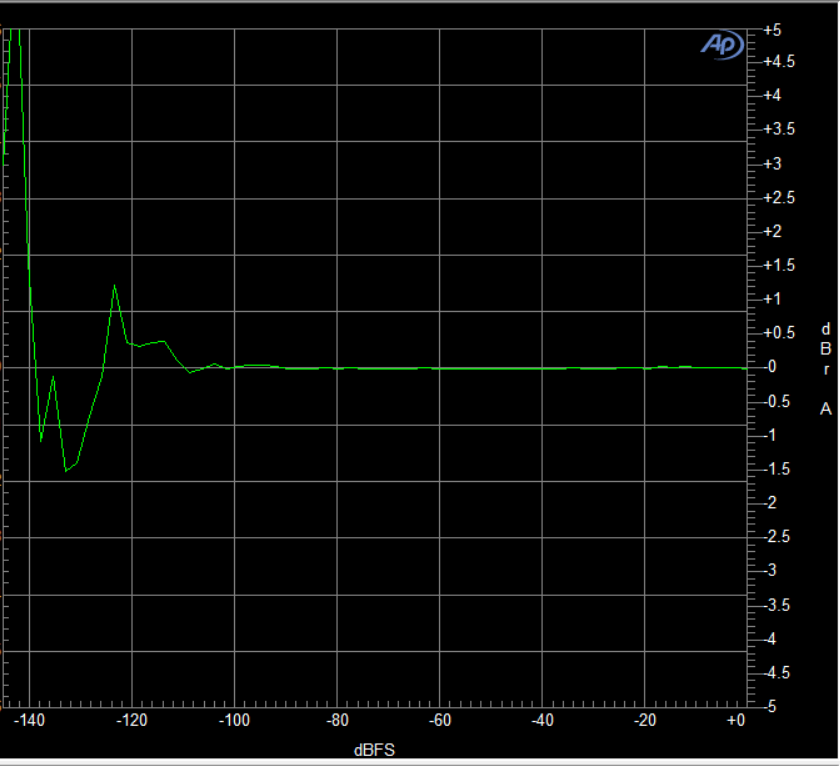
Digital to Analog conversion is equally important and here, the UA 2192 is much more accurate. In the graph below, showing the left channel, note we’re withing 1dB of linear all the way down to -122dBFS and within 3dB to -140dB. This corresponds to quite good accuracy to 23 bits. Enabling dither at 23 bits will likely make this sound pretty solid.
Frequency Response
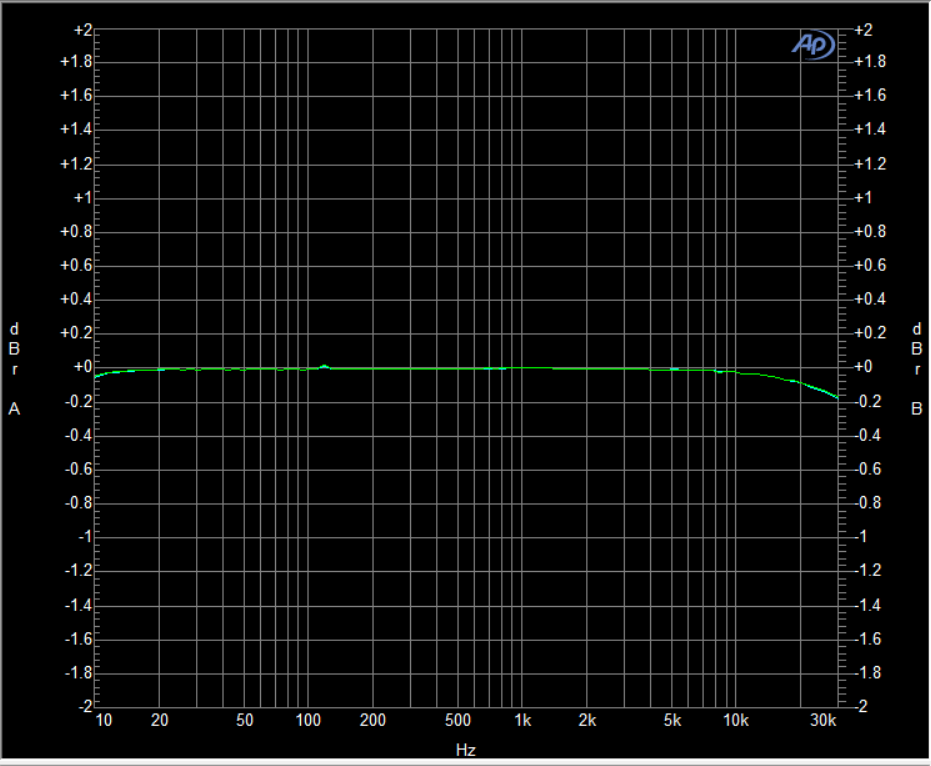
Flat frequency response is expected in modern devices and the UA 2192 doesn’t disappoint. Testing from analog in to the AES out and then back to the AES in and analog out, so A/D to D/A, with a 96kHz sampling rate shows exceptional frequency response down slightly at 10Hz and 20kHz, down .2dB at 30kHz.
Harmonic Distortion
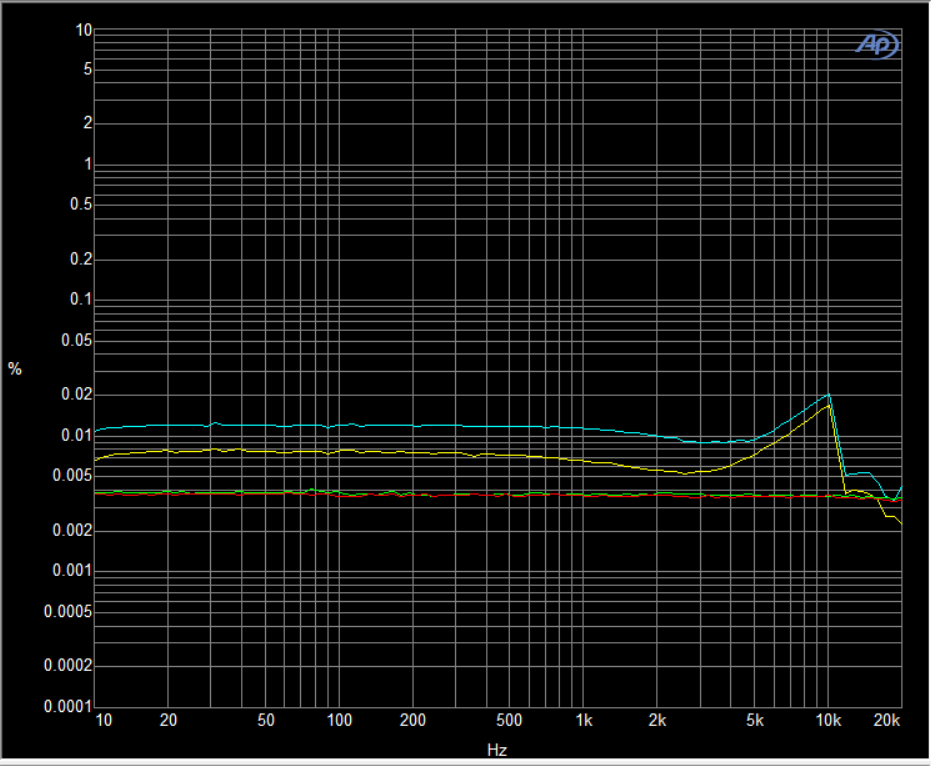
It is useful to look at harmonic distortion, usually measured as Total Harmonic Distortion + Noise in a few different ways. First, THD+N across the frequency spectrum. The graph below has two sets of measurements, the teal and yellow lines are THD+N at 0DBFS where the green and red lines are at -18dBFS, the nominal level.
Interesting to note, typically measurements at a higher level, like 0dBFS, would exhibit the same or lower distortion as the nominal level. While the readings at 0dBFS are not terrible, they do point to challenges the device is having at higher levels.
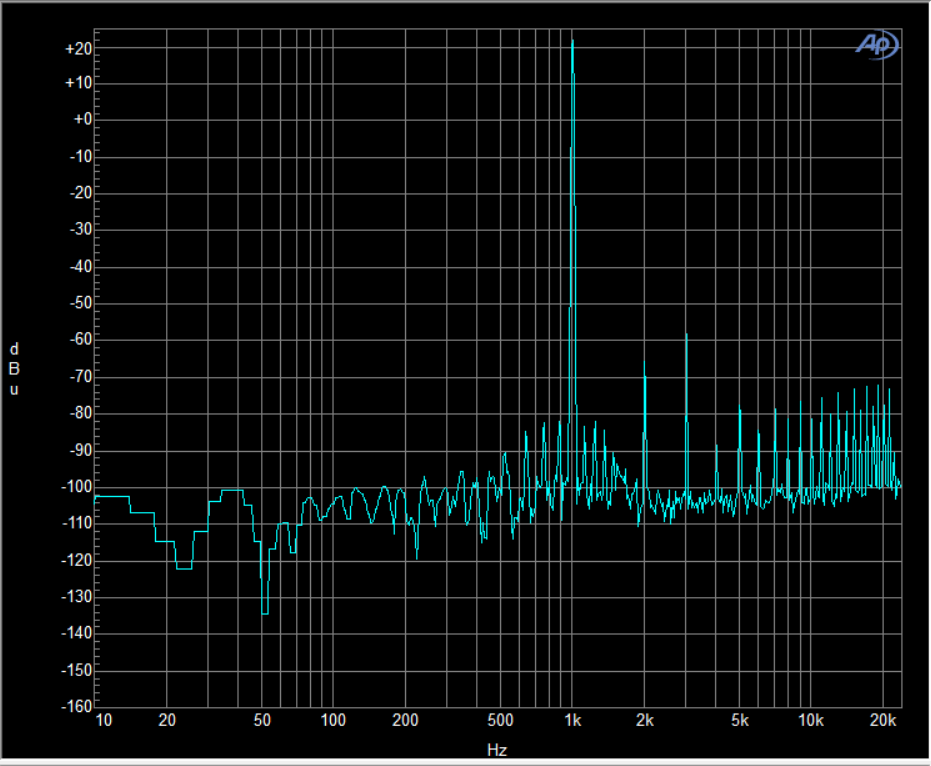
Another view uses the FFT techniques to illustrate the harmonics individually. The next graph shows a 1kHz tone as the dominant tone and clearly shows the harmonics above the noise. This is at 0dBFS.
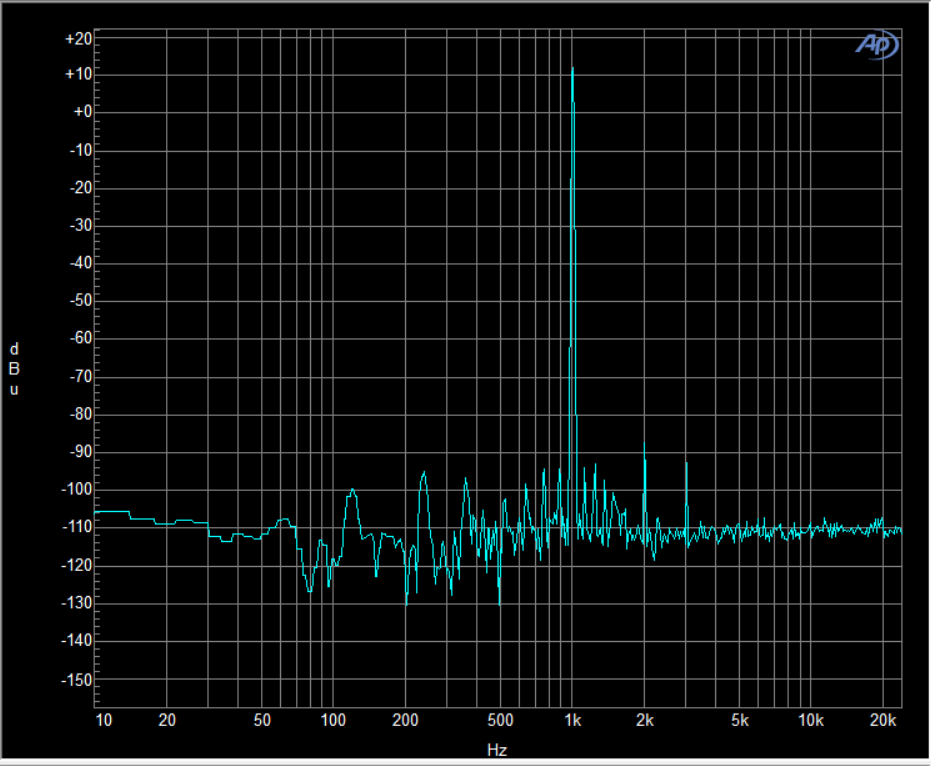
Same test at -10dBFS shows the harmonics diminishing significantly, everything above the 3rd harmonic is in the noise. Comparing these 2 charts, the device is clearly working harder at full scale. That being said, the 2nd harmonic is equivalent to .01% if measured in a ratio, so the distortion is still quite low.
Intermodulation Distortion
Intermodulation Distortion (IMD) tests how the unit handles complex tones, mixing two separate tones together to stress the electronics more. IMD is often said to introduce a brittle edge to sound, so keeping IMD low is a big deal.
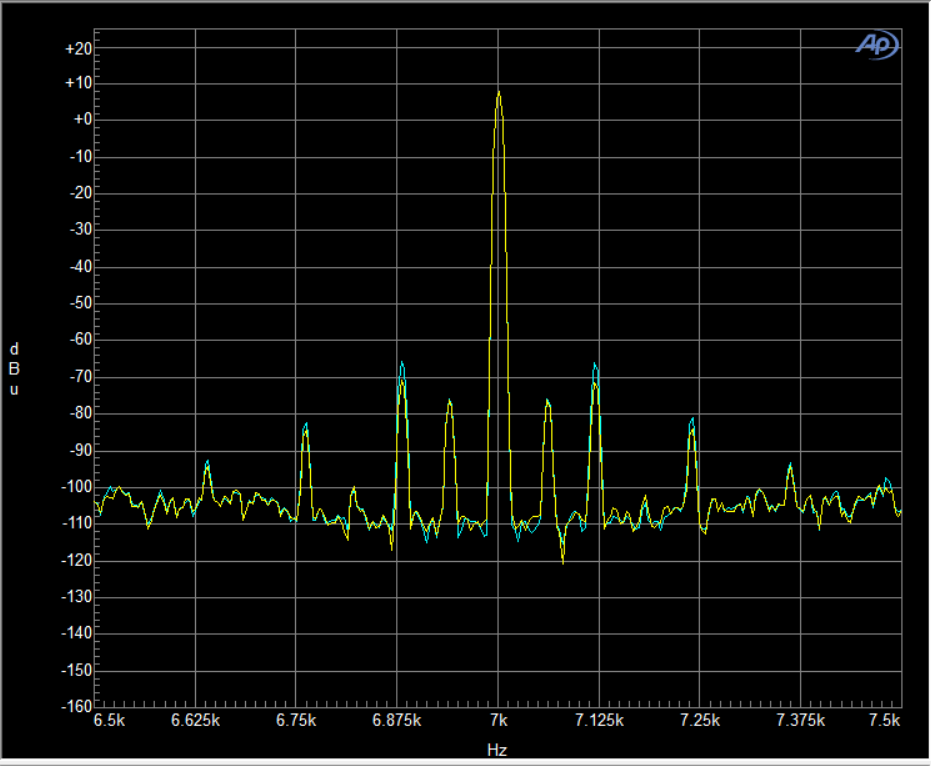
I measured IMD using two standards, both using FFT. The first test mixes 7kHz and 60Hz with the 7kHz signal 4 times the strength of the 60Hz signal. This is most commonly used in the US.
In the graph shown below, at 0dBFS, you’ll see the main peak at 7kHz and a number of smaller peaks on either side. These are the IMD components, the intermodulation artifacts. They are each 60Hz away from 7kHz. Again, these are 80dB down from the peak, or about .01%, but you’ll note in the following graph, they generally disappear at lower levels.
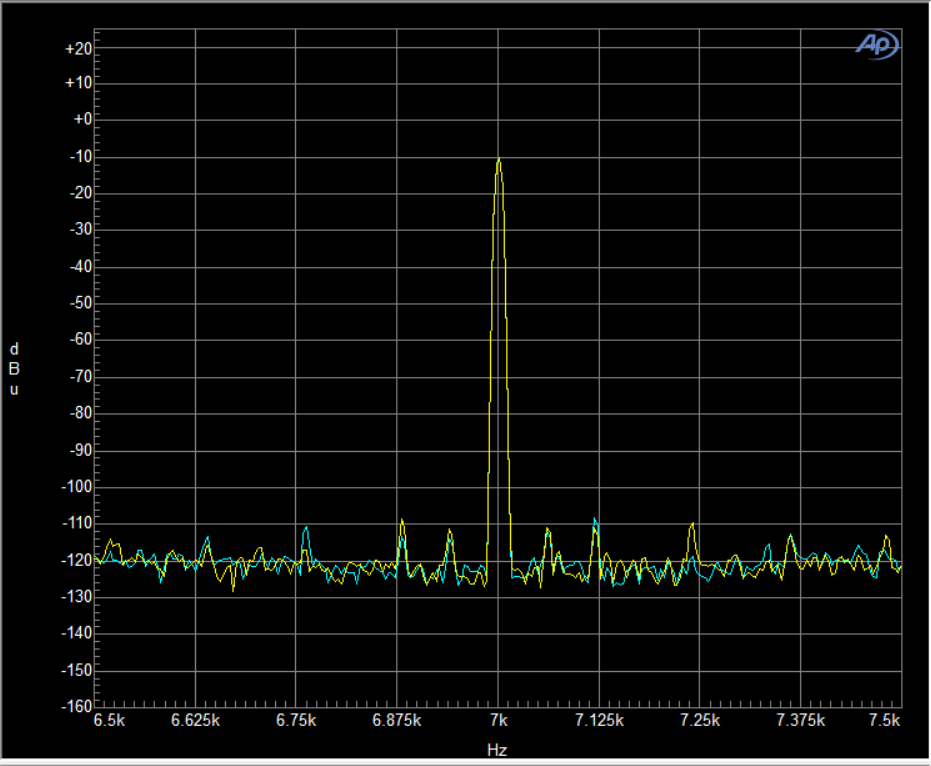
Next is the same test at -18dBFS. While the primary signal has dropped 18dB, the artifacts are now 90dB below the primary, indicating the circuitry handles signals much better at this lower level.
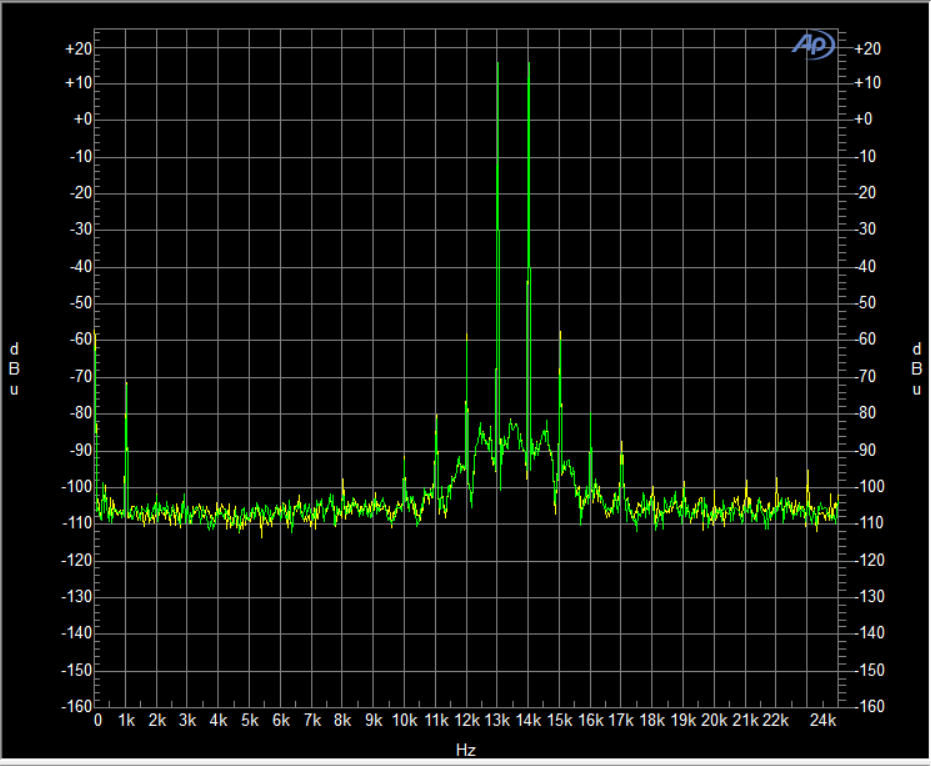
The Europeans take a slightly different approach to IMD mixing two higher frequencies, 13kHz and 14kHz at equal levels. On this first graph at 0dBFS, you’ll see again the prominent artifacts at 1kHz multiples, down about 75dB in this case, or around 2% of peak. The peak on the left is at 1kHz, the difference frequency. Ideally, we would not see anything at 1kHz.
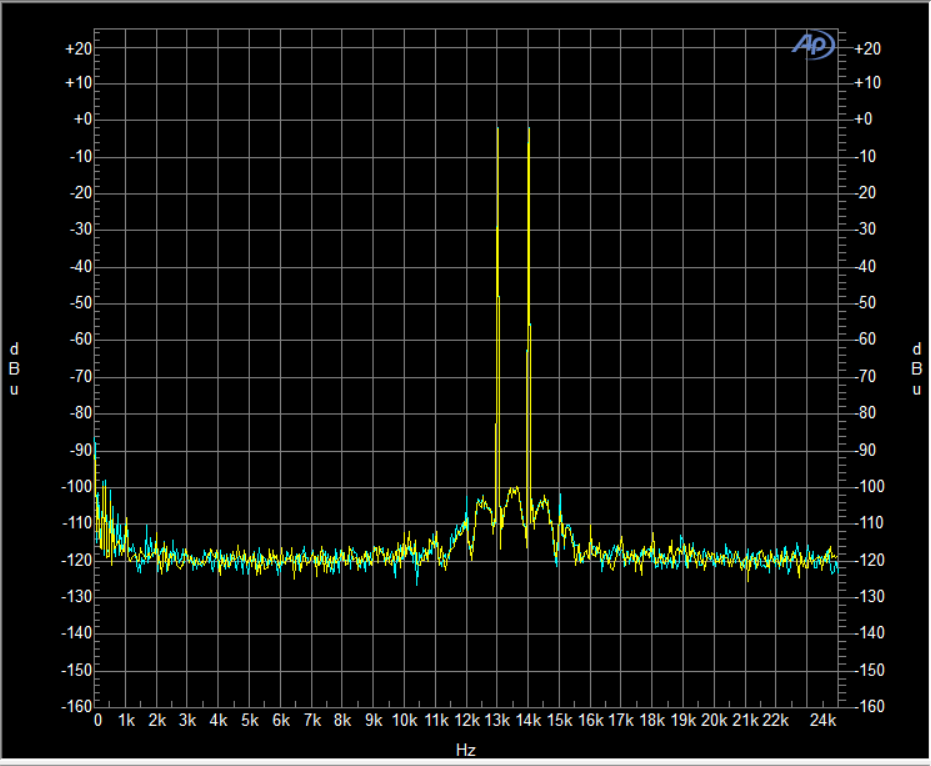
Here is the same test at -18dBFS. note the artifacts have fallen more than the primary signals and the 1kHz artifact is generally in the noise.
Conclusion
For its vintage, the UA 2192 is a great converter. Even at 7 years old it is still a solid performer with 2 minor caveats.
- Input and output are sensitive to high level signals. Given today’s trend of loud recordings, one will need to be very careful with the high-level signals.
- A-D has inaccuracies below 20 bits or -120dB. For most uses, this will not be a significant issue but for quieter recordings, you may lose some detail.
You’ll be well served by the UA 2192’s stable and flexible clock as well as the full variety of inputs and outputs.